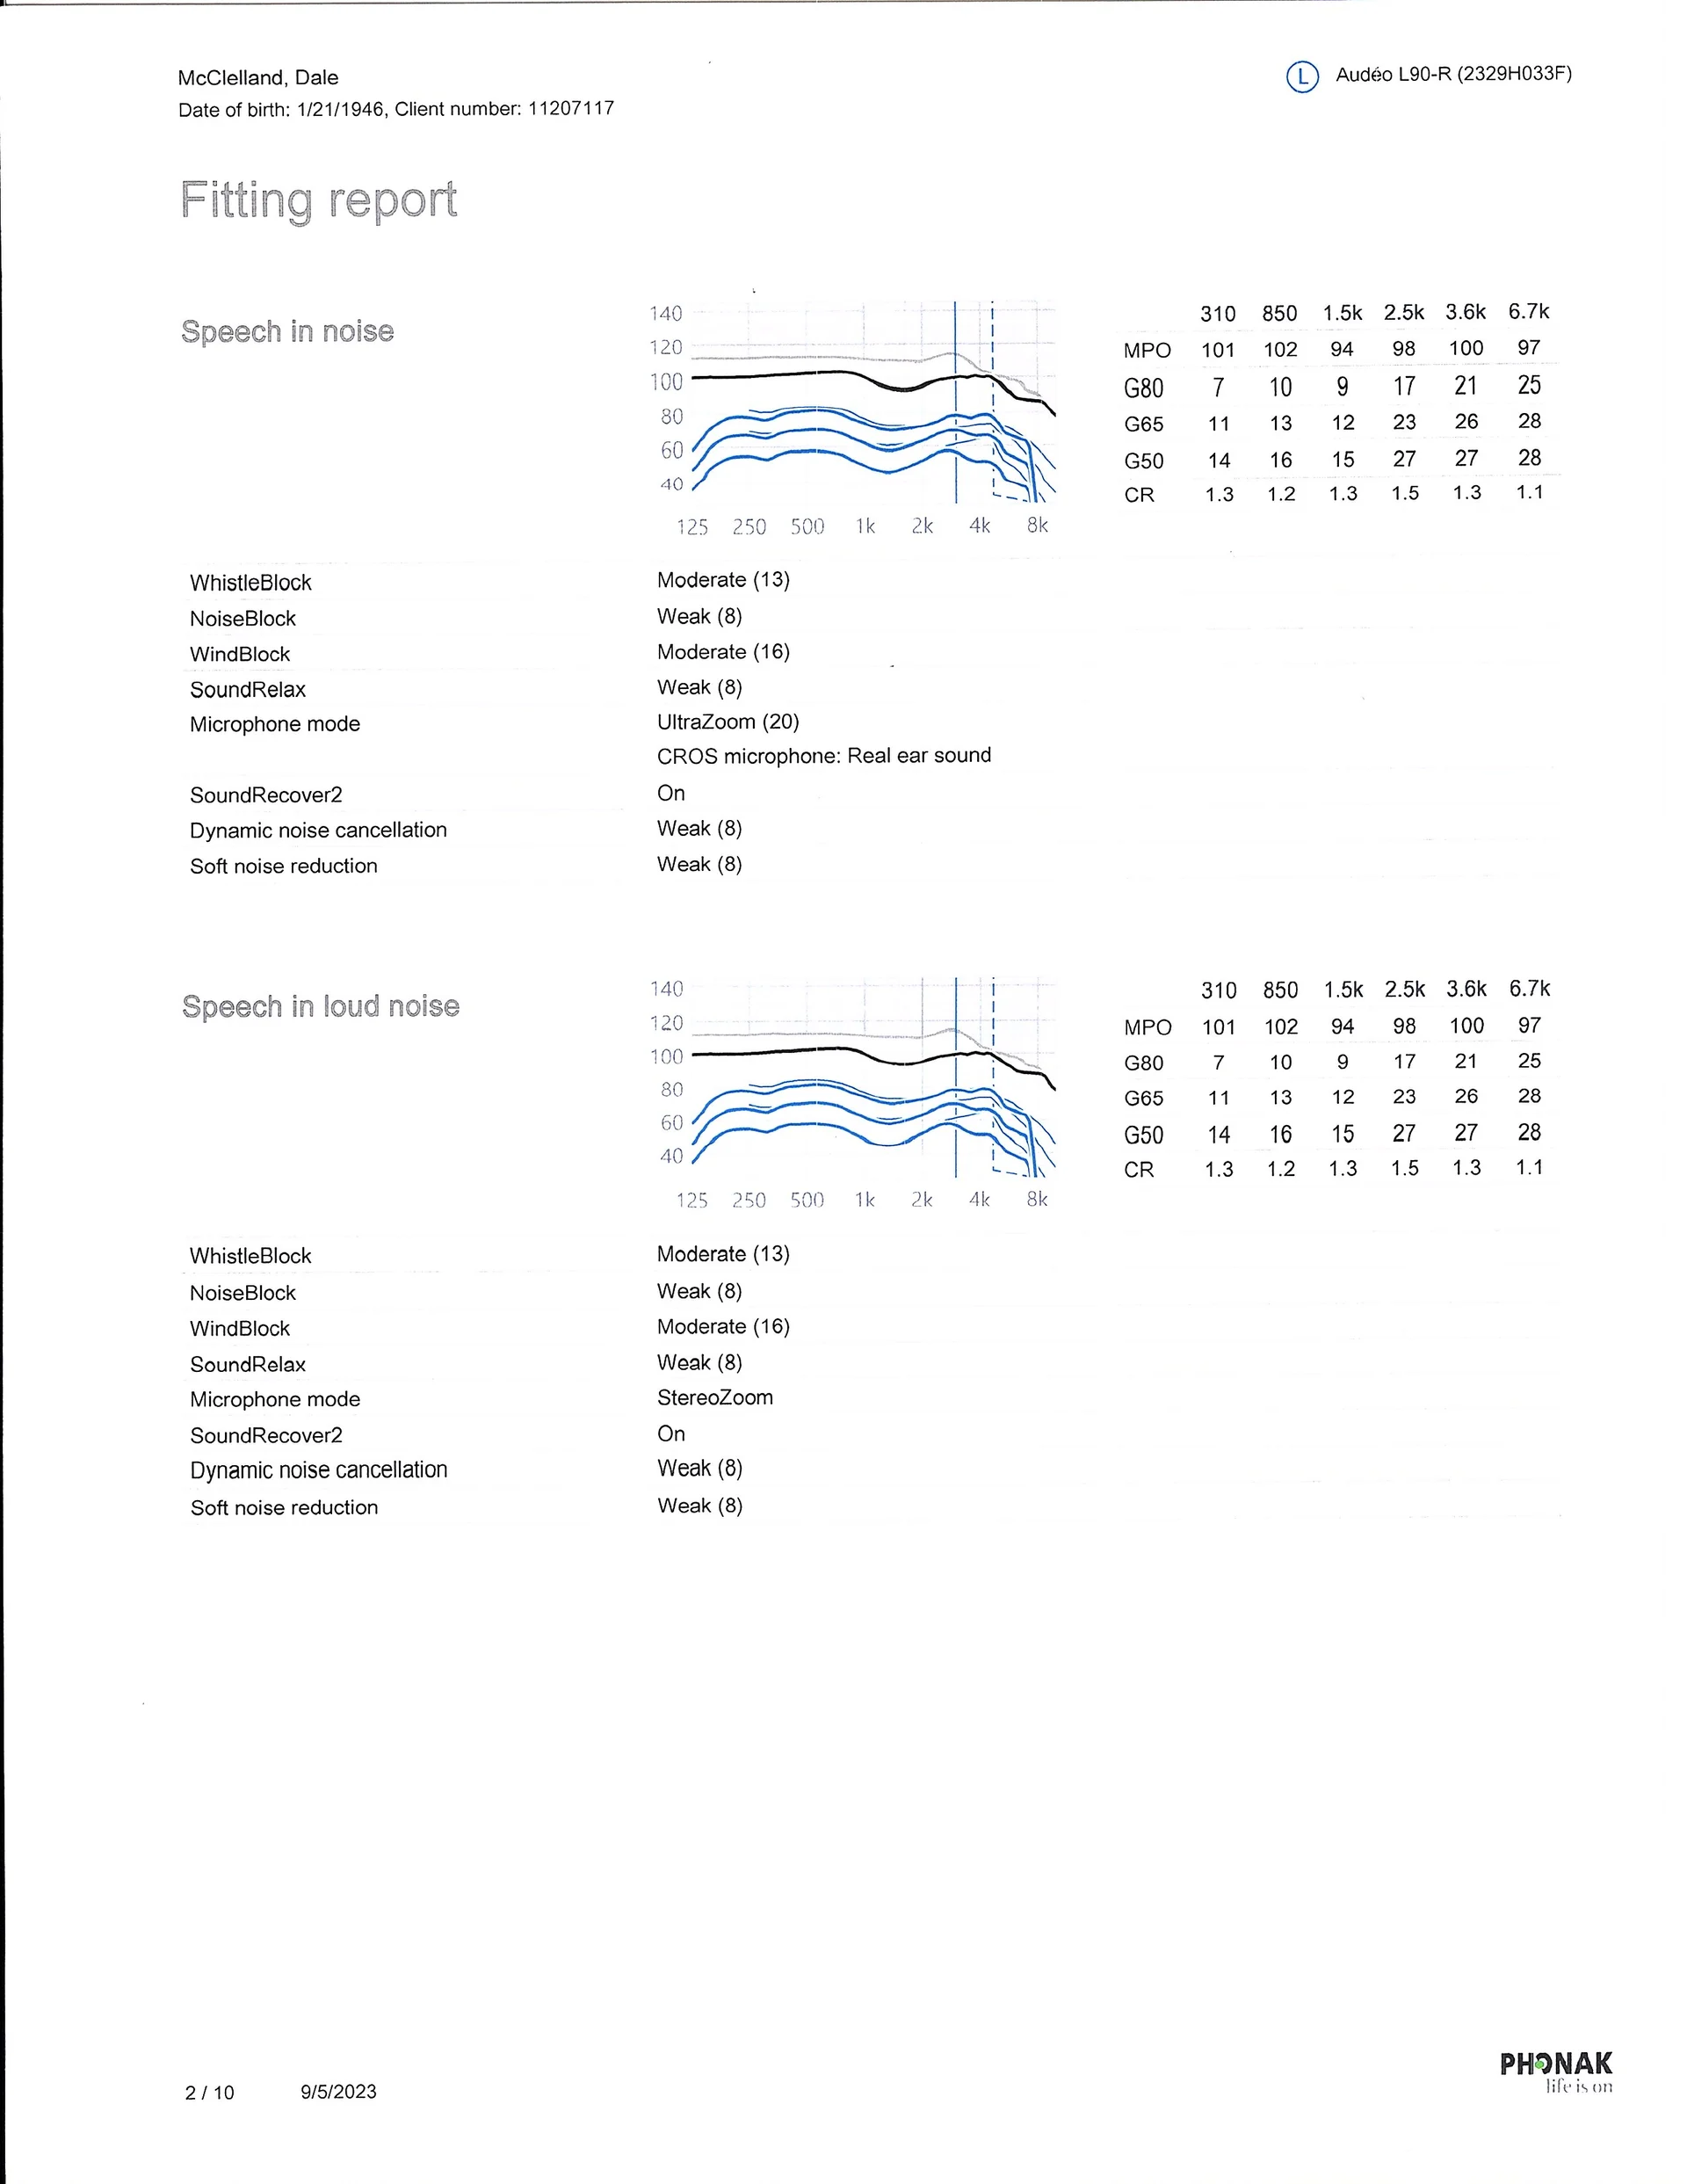
I have new Phonak Lumity L90R in bi- mode. I was fitted yesterday and asked for a fitting report, which the gave me. I am not sure how to interpret some of it. I attached a sample page that I scanned. What does the black line on the graph represent, as well as the 3 blue lines?
I would have guessed that the blue lines represent hearing at the 3 levels of speech loudness (G50, 65,80), but with the mics probes in the ear with the aid, all the HCP did was say a few sentences at a fairly low volume level. So maybe the blue lines don’t represent the 3 levels since he didn’t test 3 volume levels.
Does the various numbers here look appropriate for my hearing loss shown in my ?
You’re ignoring this member’s posts.