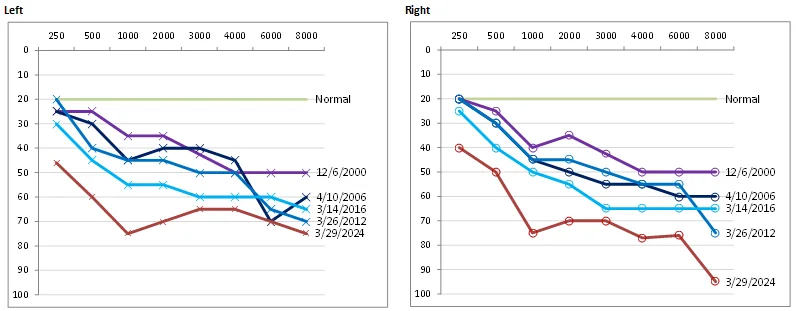
When I get a new hearing test, I’m always interested in how my hearing has changed over time. The standard report does not show this. I can find a copy of my previous audiogram and compare the two pieces of paper, but it is hard to really see what has changed, especially when the right and left ears are shown on the same graph.
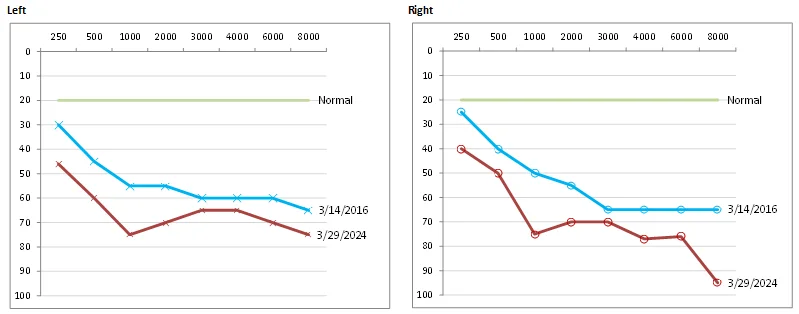
So I’ve taken to entering the results in a spreadsheet and creating graphs of the changes over time. I have separate graphs for the left and right ear. Here are the results of my two most recent hearing tests:
Questions for the forum: Do others find this kind of thing useful? Do you know of existing online tools for this? Would it be useful for me to share a copy of my Excel spreadsheet for others to modify?
You’re ignoring this member’s posts.




 Texas Hill Country