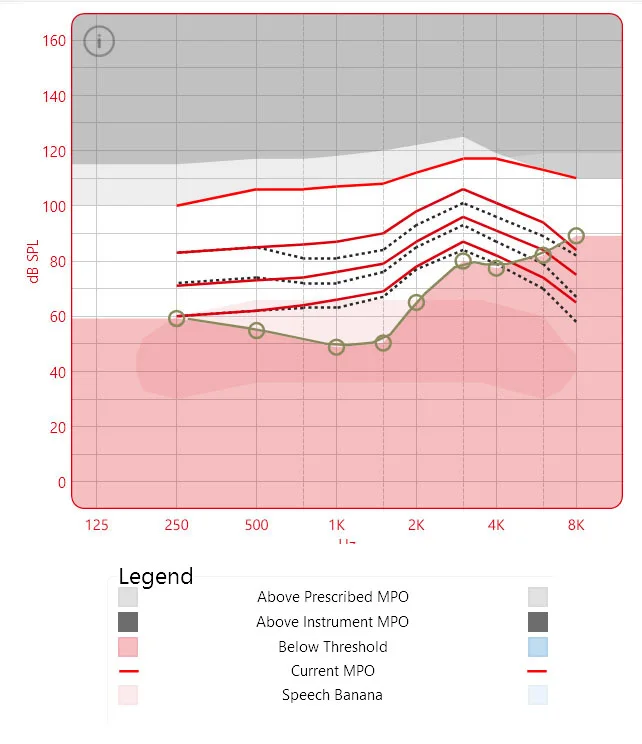
This is the Output view from my Smart Fit 2.0 software. Parts of the speech banana as well as some of the gain curves are below the threshold (i.e. in the red shaded part). I’ve asked the audiologist who says it is normal. My experience and training in reading graphs would indicate that anything below a threshold is ignored. Can anyone provide an explanation?
I have the same question, and can’t find anyone that can explain it, which probably includes your audi - it’s a mystery, and I think there’s good information in there.
The red area at the bottom is the area that you can’t hear without hearing aids.
The top red line is the maximum output your are able to deliver
The three red lines below are the output from your HA when it detects input levels of 50dB, 65dB, and 80dB. For example:
Bottom red line (50dB input): if the HAs detect a 50dB signal at 250Hz, they will amplify this to 60dB. A 50dB signal at 3KHz will be amplified to 85bB.
Third red line from the bottom (80dB input): if the HAs detect an 80dB signal at 3K, it will get amplified to 105dB.
The three dotted lines are what the fitting software originally suggested. Your audi modified this slightly, and you ended up with the red lines.
Why are some of the lines below the threshold? For example, If you look at the 80dB line (third red line from the bottom) it shows that an 80dB input signal gets amplified by only 5dB to about 85dB at 8KHz.
You listening threshold is at 90dB, so you still won’t hear it. However, a 90dB input signal would also be amplified and that would put it over the listening threshold. The graph simply doesn’t show this.