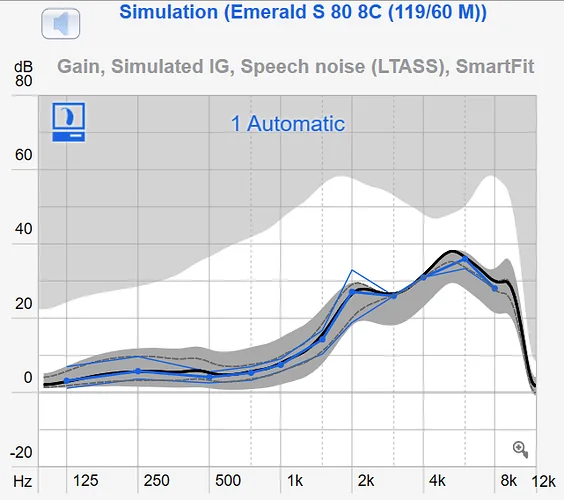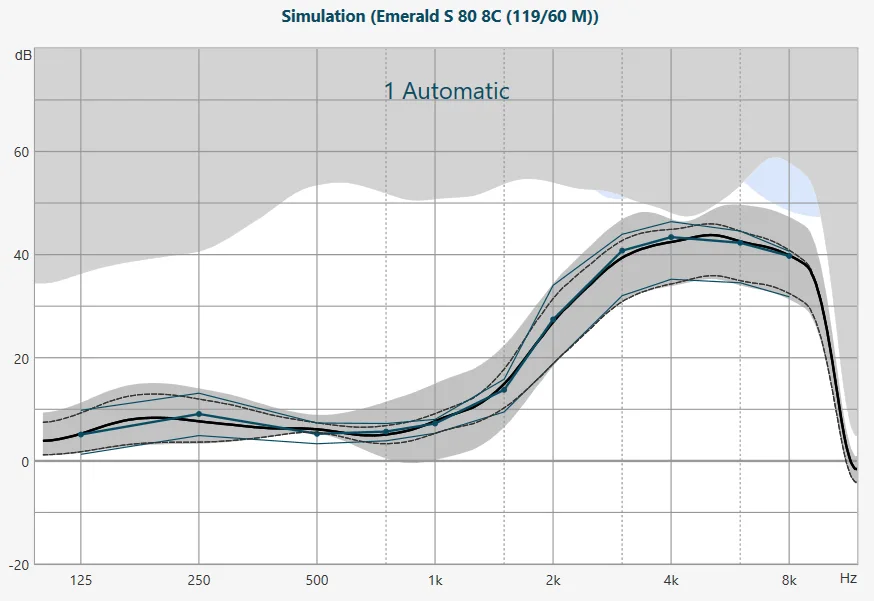

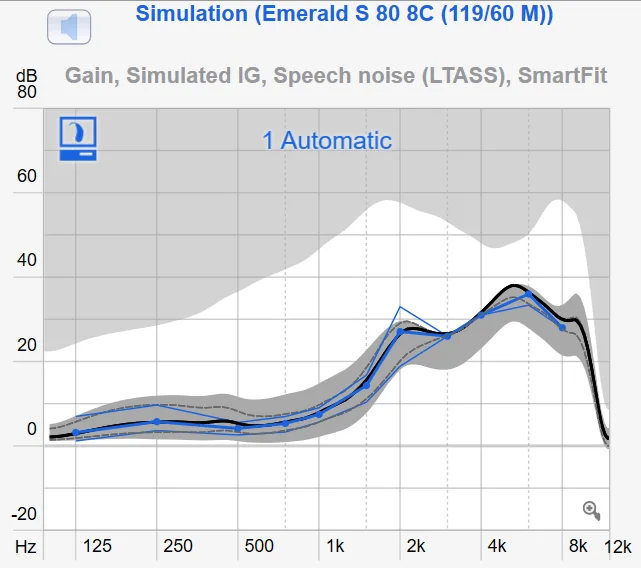
Can someone explain what the various curves on the graph above mean? On the first one which uses the Rexton SmartFit Power for a formula, lets take the 2 kHz line for an example. From the top down when you mouse over the various curves I see the following:
Thin Blue - Target Curve: 50
Dashed black - Hearing Instrument: 50 dB
Solid Black - Hearing Instrument: 65 B
Thick Blue - Target Curve: 65 dB
Dashed black - Hearing Instrument 80 dB
Thin Blue - Target Curve: 80 dB
Then there is the gray are which displays as VC Range - What is the significance of this area?
And the second part of the question is what is the significance of the fitting formula fitting within the gray area? The forumula fit seems to create a broad grey area and the curve seems to follow a gain that is somewhat independent of my loss curve.
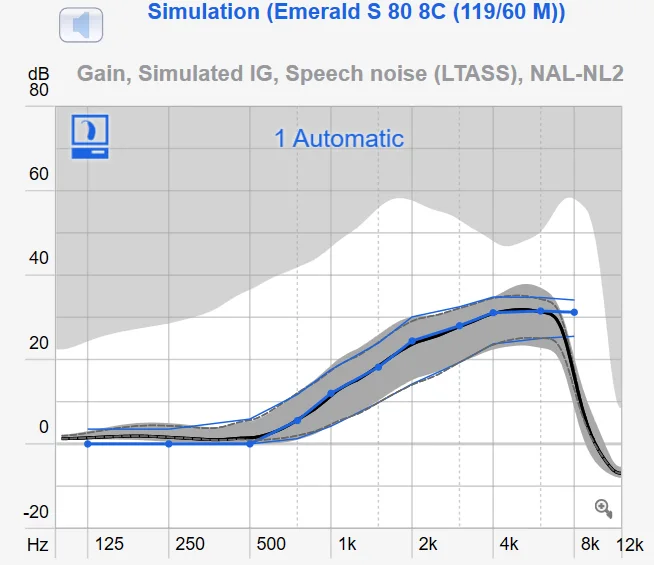
You’re ignoring this member’s posts.